How elite engineering organizations use unified dashboards to align delivery speed, platform maturity, and business outcomes
Introduction
In today’s software-driven world, CTOs and Engineering Directors face a paradox: they are expected to ship faster, maintain higher quality, reduce costs, and stay secure — all simultaneously. Managing these competing demands without a unified view is like flying a commercial aircraft using only a speedometer.
The CTO/Director Engineering Governance Dashboard solves exactly this problem. It brings together DORA metrics, platform maturity signals, security and cost governance, and business outcomes into a single, coherent control plane — giving engineering leaders the situational awareness they need to make confident, data-driven decisions.
This post breaks down every component of this dashboard and explains why it matters.
Section 1: The Top-Line Metrics — DORA, Platform KPIs, and Governance KPIs
The dashboard opens with three clusters of headline metrics. Together, they answer the CTO’s most important questions at a glance.
DORA Metrics
The DORA (DevOps Research and Assessment) metrics are the gold standard for measuring software delivery performance:
| Metric | Target | What It Tells You |
|---|---|---|
| Deployment Frequency | Multiple / Day | How often value reaches production |
| Lead Time for Changes | < 1 Day | Speed from commit to production |
| Change Failure Rate | < 15% | Quality and stability of releases |
| MTTR (Recovery Time) | < 1 Hour | Resilience when things go wrong |
Hitting all four benchmarks simultaneously is what DORA calls “Elite” performance — the top tier of engineering organizations globally. It is not just about speed; it is about sustained, reliable speed.
Platform KPIs
Platform KPIs measure whether the internal developer platform is actually being adopted and delivering on its promise:
- Golden Path Adoption: 92% — Nearly all teams are using standardized delivery pipelines, eliminating bespoke, risky, one-off setups.
- Self-Service Adoption: 88% — Most developers can provision services, pipelines, and databases without raising a ticket.
- SLO Compliance: 99.95% — The platform itself is reliable enough to be trusted by every team.
These numbers confirm that the platform is not shelf-ware. It is the primary way work gets done.
Governance KPIs
Governance KPIs ensure velocity never comes at the expense of control:
- Security Compliance: 98% — Policy-as-code and automated scanning catch gaps before they reach production.
- Cost Efficiency Trend: -18% — Engineering costs are falling while delivery velocity is rising, a rare and powerful signal.
- Risk Score: Medium — The organization is neither reckless nor paralyzed. Risk is understood and managed.
Section 2: Platform Maturity Matrix — Where Are You on the Journey?
The Platform Maturity Matrix gives leaders a shared vocabulary for describing their engineering organization’s current state — and a roadmap for where to go next.
| Level | Name | Characteristics | DORA Rating |
|---|---|---|---|
| L1 | Manual | Ticket-based ops, manual deployments, no standards | Poor |
| L2 | Automated | CI pipelines, infrastructure automation, basic monitoring | Average |
| L3 | Standardized | Shared templates, standard observability and security | Good |
| L4 | Golden Path | Self-service deployment, reusable platform services, policy as code | High |
| L5 | Platform Product | One-click service creation, automated governance, internal developer platform | Elite |
Most organizations linger at L2 or L3 without a clear path forward. The maturity matrix makes the journey explicit. An L1 shop has concrete, actionable steps to reach L2. An L3 shop can see exactly what investments will unlock L4 performance. Leadership can fund the right initiatives because the destination is no longer abstract.
Section 3: The Golden Path — A Standardized Delivery Pipeline
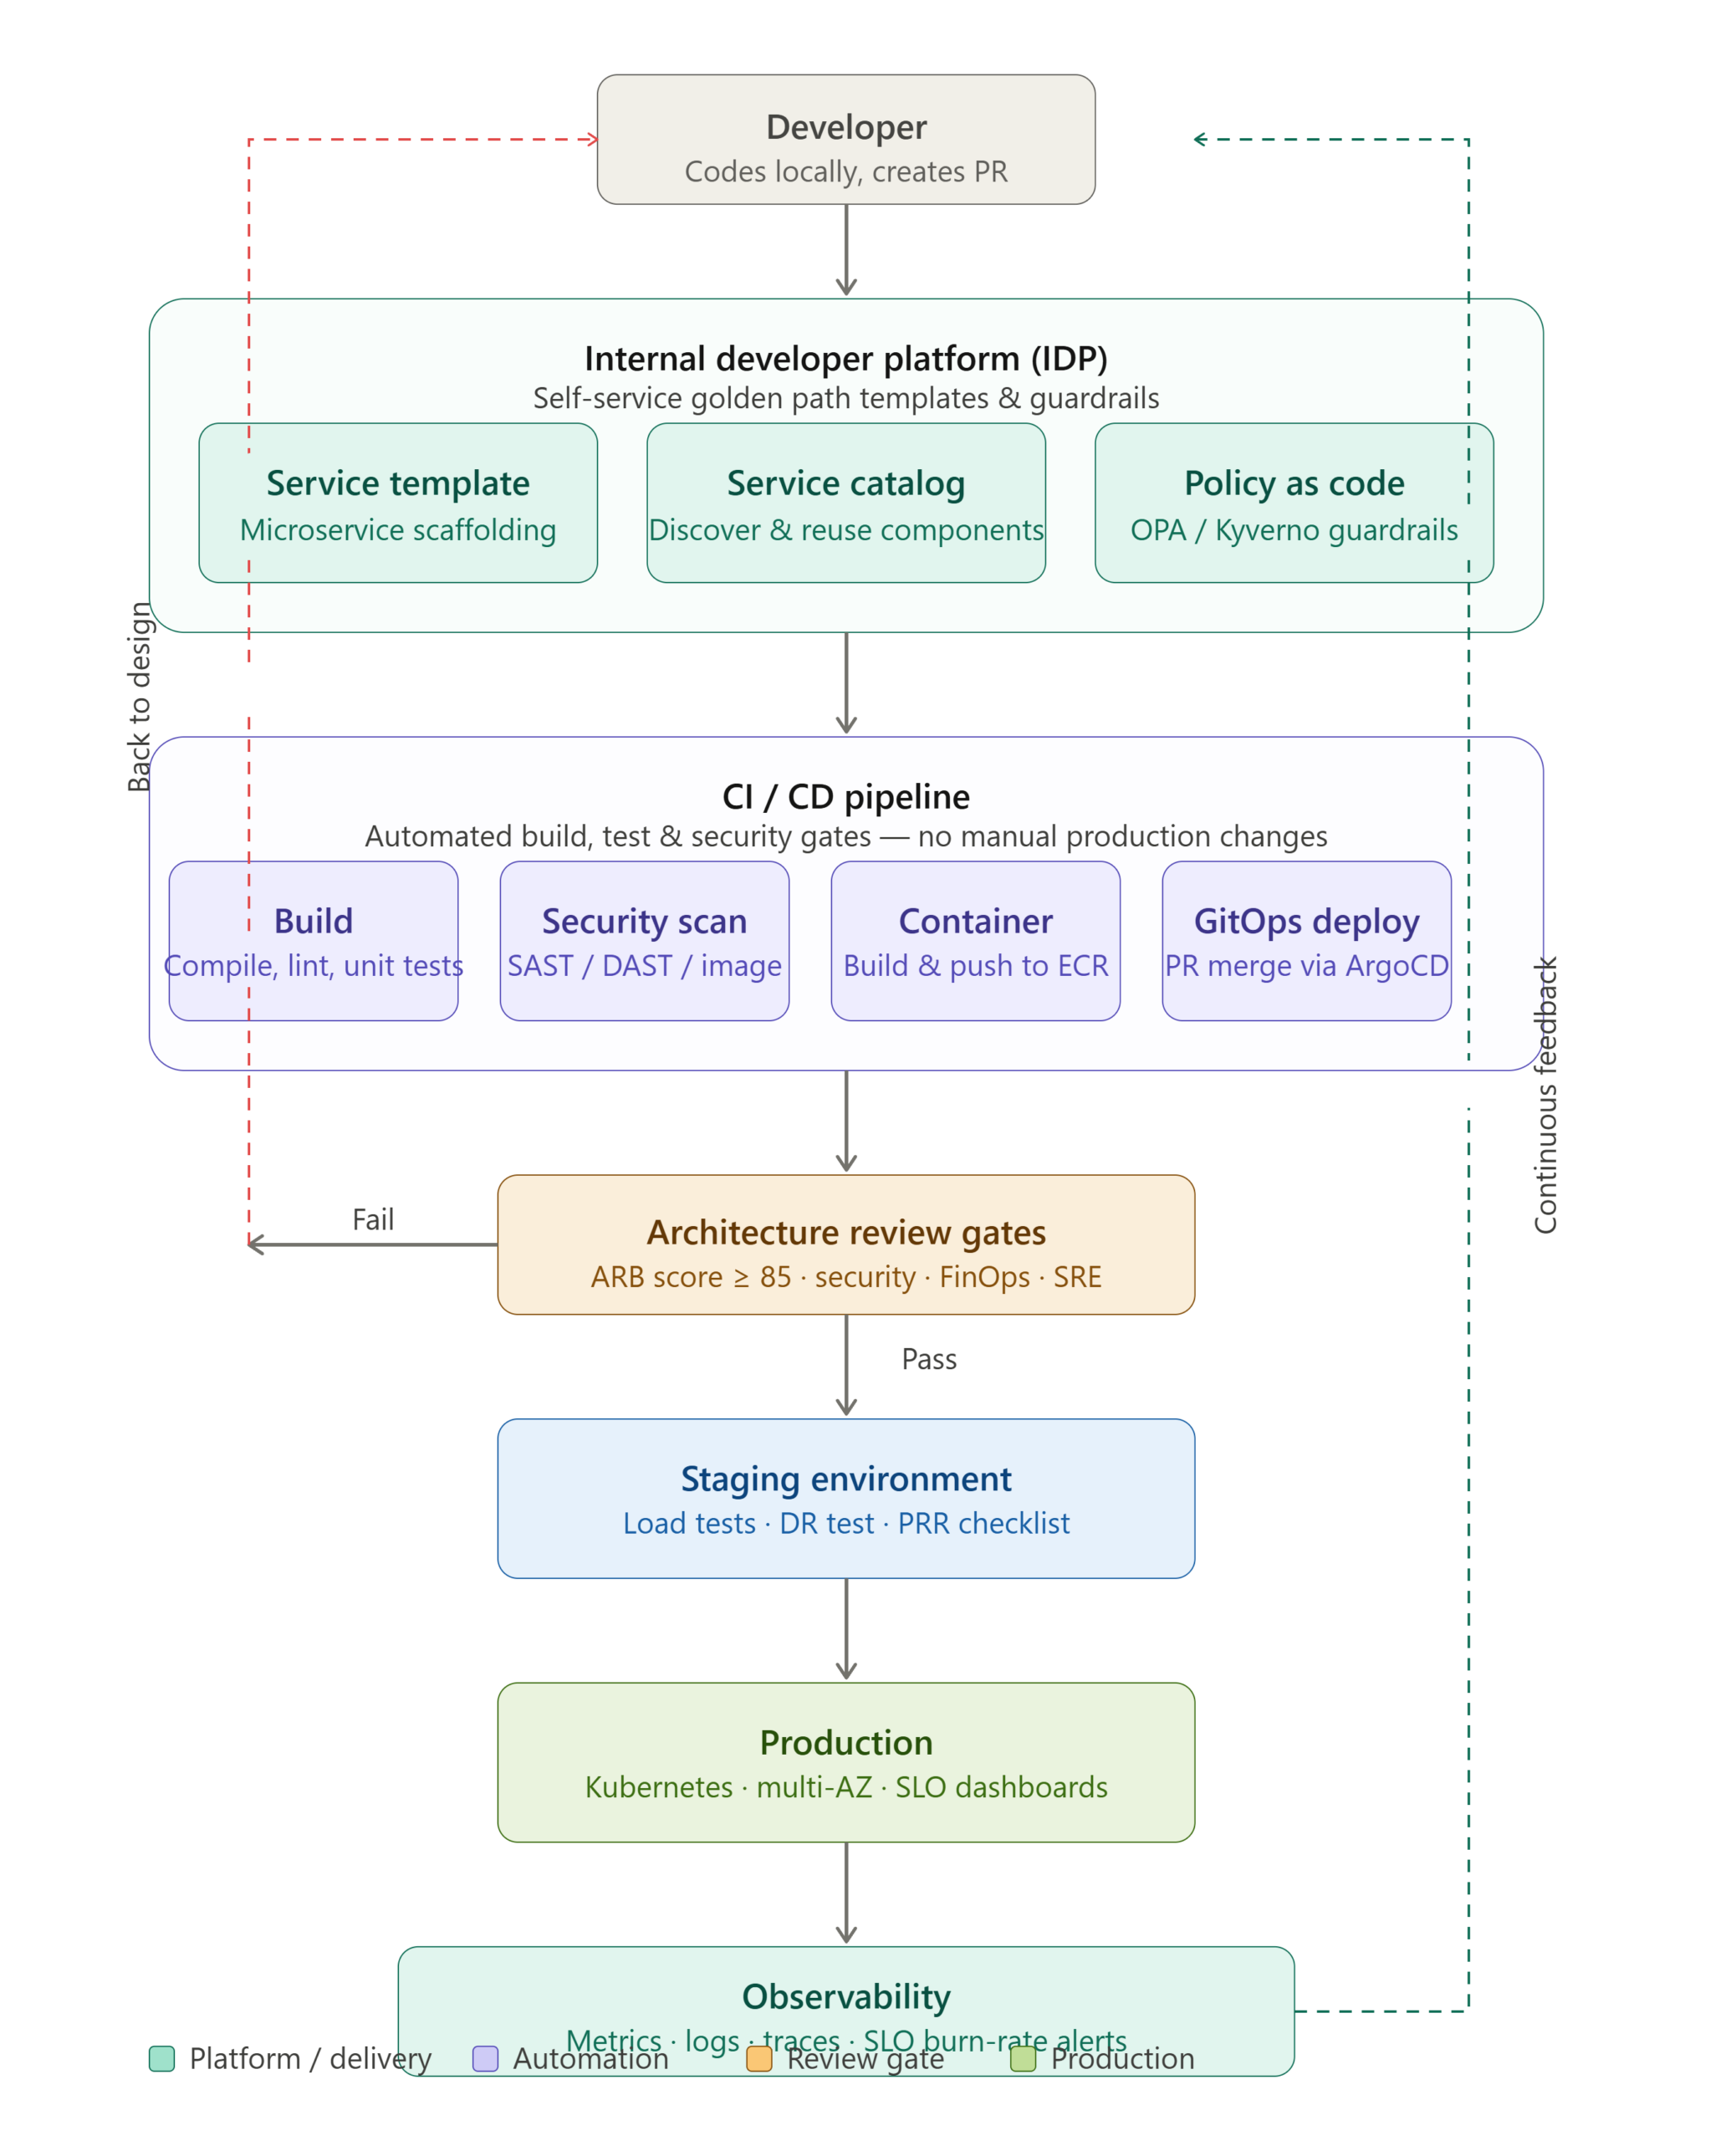
The centerpiece of the dashboard is the Golden Path: a 12-stage, end-to-end delivery pipeline that encodes every engineering, security, and compliance requirement into an automated workflow.
Stages 1–7: From Code to Artifact
CODE → BUILD → QUALITY → SECURITY → SBOM → SIGN → PACKAGE- Code — Developers push to GitHub, the single source of truth.
- Build & Unit Test — Every commit triggers automated build and test.
- Quality Scan — SonarQube enforces code quality gates, blocking technical debt from accumulating.
- Security Scan (SAST/DAST) — Static and dynamic analysis catch vulnerabilities before deployment.
- SBOM Generation — A Software Bill of Materials is produced for every artifact, enabling supply chain transparency.
- Artifact Signing — Every artifact is cryptographically signed, ensuring integrity from build to production.
- Package → Artifact Registry — Only signed, verified artifacts are stored and eligible for deployment.
Stages 8–12: From Artifact to Production Feedback
DEPLOY → RUNTIME → OBSERVABILITY → ALERTING → FEEDBACK- Deploy — ArgoCD manages GitOps-based deployments, making every change declarative, auditable, and reversible.
- Runtime — Kubernetes provides consistent, scalable infrastructure in production.
- Observability — Prometheus and Grafana, backed by OpenTelemetry, provide deep visibility into system behavior.
- Alerting — Alertmanager routes intelligent, actionable notifications — not alert fatigue.
- Feedback — The SLO/DORA Feedback Loop closes the loop, feeding production signals back into engineering decisions.
Cross-Cutting Controls
Woven through every stage are non-negotiable controls:
- RBAC & IAM — Role-based access, least privilege by default.
- Secrets Management — No credentials in code, ever.
- Network Policies — Zero-trust networking between services.
- Policy as Code (OPA) — Compliance and security rules enforced automatically.
- Audit & Compliance — Every action logged and traceable.
- Data Protection — Encryption and data handling enforced at the platform level.
Section 4: Self-Service Developer Platform
The Self-Service Developer Platform is the practical user interface of the Golden Path. Developers interact with it through six capability surfaces:
| Capability | What It Provides |
|---|---|
| Create Service | Bootstraps a new service from an approved standard template |
| Create Pipeline | Instantiates a pre-built CI/CD pipeline in minutes |
| Create Database | Provisions an approved, compliant database service |
| Create Kafka Topic | Sets up event streaming with standard configuration |
| Create Dashboard | Deploys pre-built observability dashboards instantly |
| Create Alert | Configures alerting from a standard, opinionated template |
Each of these replaces what used to require a ticket, a wait, and a bespoke setup. The result is developer time spent on product value — not platform plumbing.
Section 5: Quantifying the Business Outcomes
The dashboard connects engineering metrics to the language of the boardroom. When a CFO asks “why should we invest in platform engineering?”, the answer is concrete:
- Faster Releases — Deployment frequency of 12.4 deployments per day means customer value ships continuously.
- Lower MTTR — 28-minute average recovery time means incidents are resolved before most customers notice.
- Lower Change Failure Rate — 8.7% failure rate means the vast majority of changes succeed on the first attempt.
- Higher Developer Productivity — Self-service eliminates toil, letting engineers focus on differentiated work.
- Improved Security Compliance — Automated controls mean security is a property of the pipeline, not a post-deployment checklist.
- Reduced Platform Cost — The FinOps projection shows a clear ROI trajectory over three years.
- Better Customer Experience — All of the above translates directly into product reliability and feature velocity.
Section 6: Risk Heat Map — Seeing Risk Clearly
The Risk Heat Map plots engineering risks on a two-axis grid of Probability versus Impact. Color coding (green → yellow → red) makes high-risk areas immediately visible.
This matters because engineering risk is often invisible until it materializes as an incident. The heat map forces a regular, structured conversation about what could go wrong and where the organization is exposed. It prevents the “we knew this was a risk but never addressed it” post-mortem narrative.
Section 7: SRE Error Budget — Balancing Innovation and Reliability
The SRE Error Budget panel operationalizes the relationship between reliability and feature velocity.
With an SLO of 99.95% and an error budget of 0.05%, the dashboard shows:
- Budget Consumed: 0.026%
- Budget Remaining: 0.024%
- Overall: 98.7% of budget remaining
This single number answers a recurring executive debate: can we ship more this sprint, or do we need to focus on reliability? When the error budget is healthy, the team has permission to move fast. When it is depleted, reliability work takes priority. It depoliticizes a decision that is too often made based on opinion rather than data.
Section 8: FinOps — A Three-Year Cost Projection
The FinOps Overview translates platform investment into a financial model:
| Cost Category | Year 1 | Year 2 | Year 3 |
|---|---|---|---|
| Compute | $2.35M | $4.10M | $7.15M |
| Storage | $0.85M | $1.40M | $2.30M |
| Network | $0.45M | $0.70M | $1.05M |
| Observability | $0.30M | $0.55M | $0.85M |
| Security | $0.25M | $0.40M | $0.60M |
| Total | $4.20M | $7.15M | $11.95M |
Reading this alongside the -18% cost efficiency trend creates a compelling narrative: costs are scaling sub-linearly with growth because the platform is doing more with less. This is the compounding return on platform investment.
Section 9: Governance Workflow — How Decisions Get Made
The Governance Workflow defines the approval and control flow for significant changes:
Architecture Review → Security Review → SRE Review → FinOps Review
→ Compliance Review → ARB Approval → CTO Approval → Production Release → Continuous Improvement
This workflow ensures that no change of consequence reaches production without appropriate scrutiny. Each gate has a clear owner and scope. The workflow is not bureaucracy for its own sake — it is the organizational immune system, catching problems before they become production incidents, regulatory findings, or security breaches.
Key Takeaways for Engineering Leaders
- Unify your metrics. DORA metrics alone are insufficient. They need to be contextualized with platform maturity, governance health, and business outcomes.
- Make the Golden Path the path of least resistance. The best way to enforce standards is to make the standard thing the easiest thing. Self-service platforms accomplish this.
- Treat the platform as a product. L5 maturity requires that the internal platform has a product mindset: roadmap, users, feedback loops, and SLOs of its own.
- Connect engineering to finance. The FinOps projection and cost efficiency trend make engineering investment legible to the CFO and board.
- Let data govern velocity decisions. The error budget removes the politics from reliability vs. feature velocity debates. The data decides.
- Automate governance. Manual compliance and security reviews are bottlenecks and failure points. Policy as code, SBOM, artifact signing, and RBAC should be properties of the pipeline, not separate activities.
Conclusion
The CTO/Director Engineering Governance Dashboard is more than a collection of metrics. It is a unified theory of engineering leadership — one that connects the daily work of developers to the strategic goals of the business, through a coherent system of standards, automation, and continuous feedback.
Organizations that build this kind of visibility do not just move faster. They move faster with confidence — because they can see where they are, where the risks are, and what the data says to do next.
The question for every engineering leader is not whether to build this capability, but how quickly they can get there.
Based on the CTO/Director Engineering Governance Dashboard framework covering DORA metrics, Golden Path delivery pipelines, platform maturity models, and SRE/FinOps governance.